
I have “equality” on the brain these days. What does it mean? What does it look like? How do you know when you have it and, more importantly, how do you know when you don’t? As Kate Kelly mentioned a couple weeks ago at the Ordain Women October 5 event, “equality is not a feeling” (although it sure does feel crappy when you know you don’t have it). I’m in teacher education, so “equality” is something my students and I talk about a lot. They have assignments in which they have to go into a school and be observers of school culture. They are directed to take note of all sorts of things, some of which include depictions of different races and genders in things like bulletin boards and textbooks. They are directed to observe a class and use tally marks to indicate both the quantity and quality of teacher-student interaction, based on race as well as gender. I tell my students to listen to what the students are saying, but to also listen (meaning, pay attention) to what they are not saying. This also goes for listening to what kinds of students are saying what and, perhaps more importantly, what kinds of students are not saying things. Which students are not speaking–whether by choice or due to lack of opportunity. Who is present and who is absent? Who is leading and who is following? Who is speaking and who is listening?
As part of my dissertation work, I spent 18 months in an elementary school as a keen observer of the power dynamics at play that had to do with mostly race, class, and language, so I’ve done more than my fair share of bean-counting. It’s something I do. Once you start doing it, it’s hard to just no longer do it. At least, that’s been my experience. Quantifying things like this is just something I do.
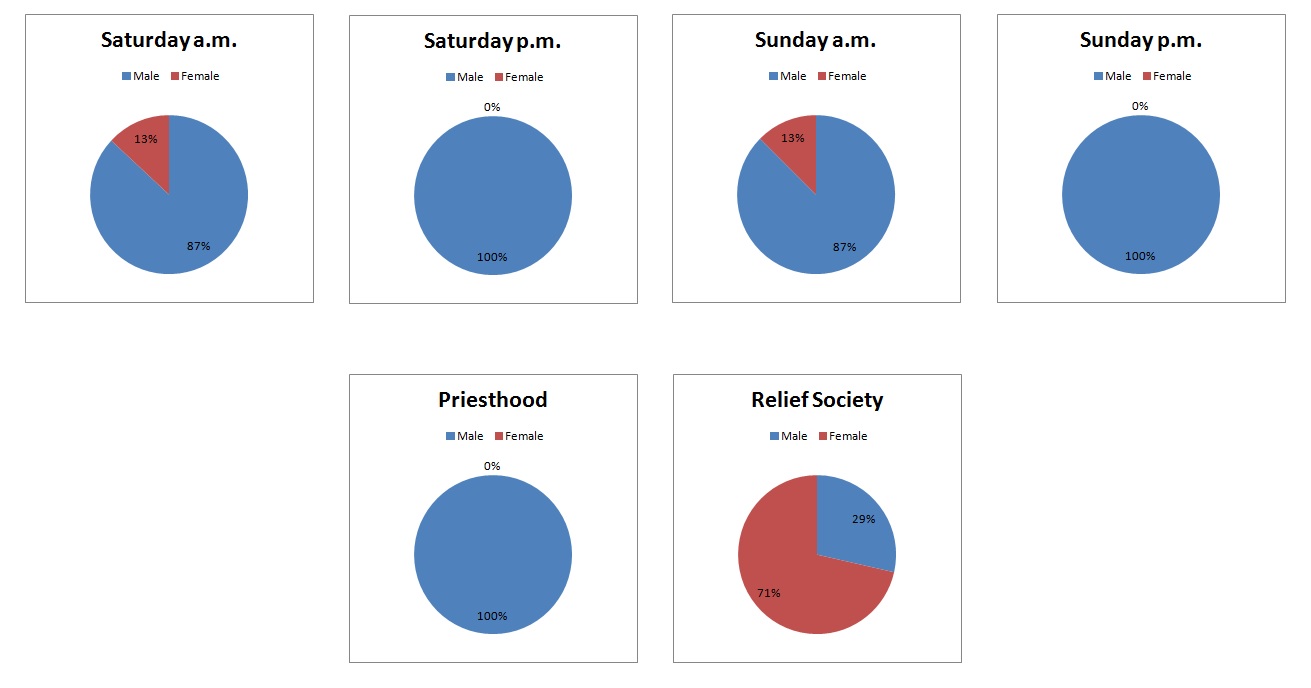
Earlier this week, I published a post with one possible way of measuring equality (or, in this case, inequality) in the Mormon church. Here’s another possible measurement. Below are pie charts illustrating the male-female speaking time (in number of minutes) of the 184th session of General Conference of the Church of Jesus Christ of Latter-day Saints.
To be charitable, I counted Priesthood as one session and the General Relief Society meeting as one session–even though that’s really not honest because Priesthood session occurs twice a year, whereas the Relief Society session only occurs once.
If my students brought this data to class, we’d be having a good discussion about it for sure. Who is speaking here? Who is not? To whom are they speaking? Why? Who benefits from this system? Who is marginalized? Who is rendered invisible?
And then, most importantly, we’d talk about what we can do to change it. We’d talk about the advantages and disadvantages of working from within the system versus working outside of the system. We’d talk about the importance of voting–whether in the ballot box or with our time and resources and presence, etc. We’d talk about what kinds of things are within our control and which are outside the realm of our control.
More than anything, I hope that when my students observe an inequality in an institution or organization in which they are active participants, they commit themselves to working assiduously to address the problem.
[For more Equality is not a Feeling posts, see the archive here.]
Wow, seeing the charts puts a stark reality on this for me! Amazing it was so ingrained in me to not even think twice about this before.
Great point, Heather, and great illustration!
Quantifying things like this is just something I do.
Ah, and this is one of the many reasons I think you are awesome! :)
That this needs to be quantified to be seen is indicative on its own how out of step mainstream mormonism is with very simple ideas of basic human morality. The sexism in the LDS Church is blatant and obvious, and not worthy of debating. Anyone who thinks there’s some level of nuance here is simply excusing sexism and justifying their own complicity.
If we consider the classroom scenario, doesn’t your discussion on equality take into account how many participants of each race and gender are in the classroom? So if there is one female student in a class of 50, it can’t be expected that she participates 50% of the time. She should only participate 2% of the time right? Since only persons called to leadership positions speak in general conference, there are the potential of 588 (70s, apostles, bishopric) men to speak and 9 women (RS, primary, YW presidencies). Women make up only 1.5% of the leadership and therefore speak in conference much more than they should (statistically). So the issue isn’t really face time in conference, rather the number of leadership positions help by women in the church?
I’m really stating this as a question, as a scientist I would look at all of this as data, not in the social sense. Just wondering….
Jen, yes. Huge yes, for me. ;)
I just thought the visuals were an interesting way to show the problem.
But yeah, the issue is not minutes in conference. The issue is the epic under-representation of women in leadership positions.
And also yes that the problem includes race, native country, native language, class, professional background, sexual orientation, etc. all of those things as well.
I am loving these measurements of equality. Can they be a regular feature?
csn, I’m brainstorming other things I could represent visually. Let me know if you think of something and I’ll see if I can represent it visually!
This is also very huge for someone(s) who are dear to me (young females)–
I completely understand how they feel; it’s outrageous.
I just wish I could make things better somehow, but I’ve fought my battles, and, frankly, I’m worn out. I spent my time working hard to be succinct, self-respecting and never, ever to use a “Primary” voice around the men who were patronizing–
that alone wore me out–
I think this is important not only because twice a year we hear mainly from men at conference, but also because these talks are used for Sacrament meeting talk assignments and as Teachings for Our Time lessons in Priesthood and Relief Society for the rest of the year. Thus, even if you have lots of female speakers and teachers at a local level, most of the subject matter is filtered through a male perspective.
I think it is also interesting to consider how many talks the average female or male member hears by women. If we choose to count Relief Society meeting as part of Conference (which it is not, but let’s be generous) a woman hears 5 talks by other women. (She also gets one extra talk by a man that most men do not hear.) In contrast, a man only hears from two women. Cover up the one pie that has more red on it and you see Conference from the male perspective. Women’s voices are underrepresented in general, but men are hardly ever expected to listen to women.
Exp II, when you speak of “a male perspective” for the quotes — is it also important about the topics that are quoted? I noted this conference that one of the male speakers quoted one of the general auxiliary presidency members (can’t recall off-hand). Simple tallying of who gets to do what — is that enough? I’ve seen no references in these pages of anything the Sis. Burton has mentioned during her tenure as General RS president, and she’s said some remarkable things.
What is “equality” from an eternal perspective, in your reflective opinion? With the numbers and charts you’ve shown, you’ve certainly shown how it looks to you in this world.
I appreciate the care you’ve taken with this.
Observer,
I’m not sure the distinction between definitions of “earthly equality” and “eternal equality” are significant to me. The problems I’m worried about are very much present-oriented. I make no bones about that.
So, I posted this on my FB timeline this morning, which usually gets a lot of feedback and comments…..and 45 minutes later: total silence. Can’t figure out whether people are too offended to comment, or afraid of what they’ll get from me if they do.
For me, it was a punch in the gut seeing the graphical representation. I had always vaguely felt this, but to be able to see it really threw things into sharp relief. I made no commentary in my post, I simply presented it as information: “Here’s an interesting graphical breakdown of the number of minutes men & women spoke in the last General Conference/General RS meeting”.
I think it’s information worth taking a long, hard look at. As Exponent ii April pointed out, this is the stuff of lessons aplenty in the church for the year (and years to come). At what point does church simply become an echo chamber for men’s voices and opinions? Granted, they may be very well-intentioned men, and loving fathers and husbands — I truly doubt they are bad people. But I find my perspective (or even perspectives remotely like mine in tone and rhetoric) so INCREDIBLY underrepresented that I feel like, “Why am I here?” — especially as a convert. This is a tribe I CHOSE, not one I was raised with.
Katie, FB seems to be down this morning…I can’t like or comment on anything. I’m sure there will be plenty of comments when it’s back up again. It’s an important topic.
I think its interesting that women only speak during the A.M. session. Is it always like that? The morning session is probably more likely to be missed by the general viewers than the P.M. session.
So what’s your dream conference?
I like your ideas and the questions you bring up, but say you were king of the world for a day, how would you make the church more equal? How would your student’s?
Observer, with regards to your question about whether the conference speakers are quoting women, I refer you to this post, in which the blogger counted how many women and men were quoted by speakers at a recent session of general conference. She found that conference speakers most often quote men. http://zelophehadsdaughters.com/2013/04/30/how-often-are-men-and-women-quoted-in-general-conference/